...
Extended data on fixation behavior

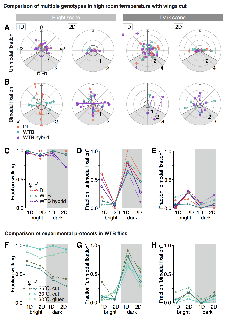
Fixation behavior across sexes and genotypes (A-E) Comparison of fixation behavior in WTB, WTB hybrid and DL flies measured at high room temperature (30 ?C) and with wings cut. (A) Fixation plots of unimodal fixation for female flies. These "fixation plots” illustrate the angular location of the fixation peak and the fixation strength based on von Mises fits. The location parameter (µ) is plotted on the circumferential axis and the shape parameter (k) on the radial axis. Markers (empty or filled circle) indicate categorization of trial based on fit. The grey arrow points toward the frontal position in the fly’s field of view. Grey shading marks the part of the field of view that is not covered by the panoramic screen. Visualization as in Fig. 3 F of Haberkern et al (2019). (B) Fixation plots of bimodal for female flies. Note different axis scale in bright and dark scenes. Visualization as in Fig. 3 G of Haberkern et al (2019). (C) Fraction of male and female flies that walked for at least 20 % of the trial time across the four trials. (D, E) Fraction of flies showing unimodal (D) and bimodal (E) fixation. (F-H) Same as (C-E), but for different experimental protocols: Flies were either wing cut and measured at high (30 ?C) or low (25 ?C) room temperature or wing glued and measured at high (30 ?C) room temperature.
Download additional data here: AdditionalMaterialAdditionalMaterialText.pdf
...
Technical details about FlyoVeR
...